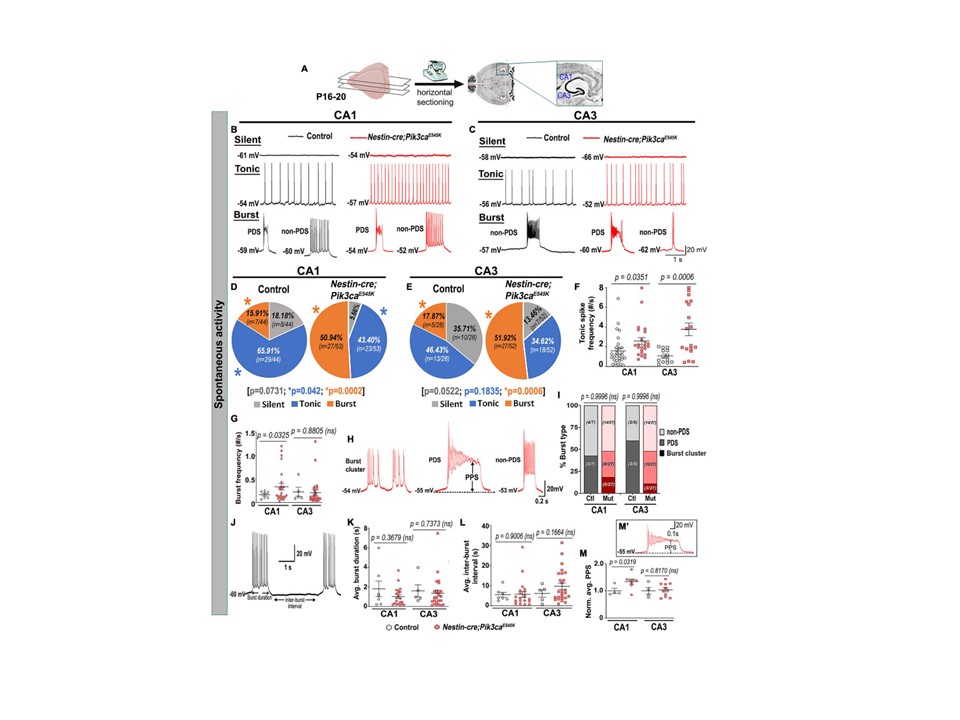
Mutant hippocampal neurons produce increased epileptiform burst activity.
(A) Flowchart shows acute horizontal brain slicing for whole-cell recording. (B–E) Traces represent silent, tonic, and burst categories of CA1 and CA3 neurons based on spontaneous cellular activity; respective pie charts marked proportion of recorded cells. Mutant CA1 and CA3 exhibited significantly higher proportions of burst-firing cells compared to controls. Significantly fewer tonic-firing cells were observed in mutant CA1. (F,G) Relative to controls, spontaneous tonic spike frequencies were significantly higher in mutant cells; burst frequency was significantly higher in mutant CA1. (H) Representative traces for subtypes of burst firing, namely burst cluster, paroxysmal depolarization shift (PDS) and non-PDS plateau bursts. (I) Proportion of burst subcategories were not overtly different in control and mutant CA1 and CA3 regions; burst clusters were only seen in mutant cells. (J) Representative trace demonstrates how burst duration and inter-burst interval were calculated. (K,L) In both CA1 and CA3, average (avg.) burst duration and inter-burst interval were not significantly different between control and mutant neurons. (M’) Plateau potential shift (PPS) in mutant bursting cells, as depicted in panel (M’), was significantly higher in CA1 but similar in CA3, compared to respective controls. Data is represented as pie charts, % bar graphs and mean ± SEM scatter plots; differences were considered significant at p < 0.05; ns, not significant; PPS, plateau potential shift. Scale bars: 1 s, 20 mV (B,C,J); 0.2 s, 20 mV (H); 0.1 s, 20 mV (M’).