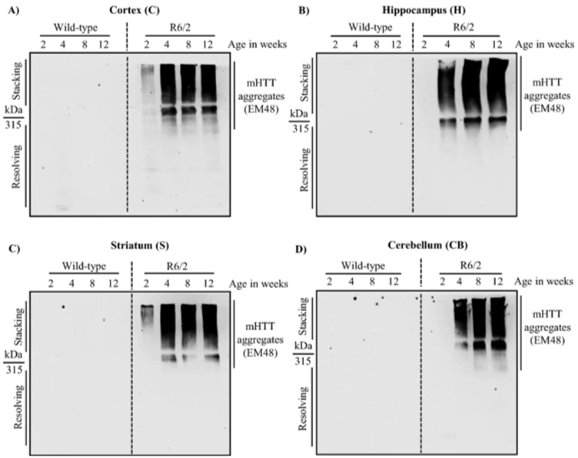
Spatiotemporal analysis of soluble aggregates and autophagy markers in the R6/2 mouse model
Dynamics of mHTT aggregate formation across different stages of disease progression in R6/2. (A)–(D) Representative blots for the expression of mHTT aggregates in R6/2 compared to wild-type control mice in the Cortex (C), Hippocampus (H), Striatum (S), and Cerebellum (CB) respectively at 2, 4, 8, and 12 weeks. mHTT aggregates were detected by EM48. N = 5 for 2 weeks, N = 7 for 4 and 8 weeks, and N = 12 for 12 weeks
Kumar, M. J. V., Shah, D., Giridharan, M., Yadav, N., Manjithaya, R., & Clement, J. P. (2021). Spatiotemporal analysis of soluble aggregates and autophagy markers in the R6/2 mouse model. Scientific Reports, 11(1), 1–20. https://doi.org/10.1038/s41598-020-78850-w